This short series of blogs chronicles the bare-bones required to conduct a basic form of social media analysis on corpora of (Japanese) Tweets. It is primarily intended for undergraduate and graduate students whose topics of research include contemporary Japan or its online vox populi, and want to strengthen their existing research (such as an undergraduate thesis or term paper) with a social media-based quantitative angle.
The purpose of this second blog is two-fold: 1) to introduce the reader to some possibilities in regards to basic social media analysis (applicable almost immediately upon having finished the previous guide), and 2) to touch upon a crucial, yet sometimes ignored aspect of social media analysis: the legal and ethical caveats regarding privacy and informed content when researching user-generated content on social media.
By using a concrete, real-world example, we will thus:
- Think about how we might integrate Twitter analysis into our project,
- Use the Python scripting language to further process our dataset to our needs and obtain relevant metrics,
- Use spreadsheet software such as Openlibre or Excel to produce pivot tables and graphs,
- Reflect on the ethical and legal ramifications of working with social media data in academic research.
Context
I assisted several third-year BA students working on a group essay covering aspects of the COVID-19 virus and marital issues within a larger framework of hegemonic masculinity, femininity and gender hegemony in Japan. Their choice of incorporating an element of social network analysis was not ungrounded. Correlating to increased remote work measures taken in Japan as a COVID-19 precaution, several hashtags concerning marital issues began to trend on Japanese Twitter starting Mid-April 2020 and saw further acceleration after being promptly picked up on by several news outlets and tabloids both within- and outside of Japan (such as the Japanese hashtag #coronadivorce, #koronarikon #コロナ
One of my research interests concerns the many ways the internet, as a cultural artifact, augments or subverts our personal reality. Of interest to this project, then, was how the explosion in usage of the above hashtags reifies in Japan a situation that is undoubtedly being felt worldwide among many (married) couples during the pandemic. Concretely we had several questions: how does Twitter (and general social media usage) fit within the lives of struggling couples trying to cope with the uncertainty of the Corona crisis and its amplification of internal relational struggles? Does the usage of those hashtags reveal any attempts on Twitter to interconnect with one another, form communities and to share advice or frustrations? If so; can we pinpoint particular group dynamics? Might we find a steady increase of Twitter users empowered enough to engage in discourse with each other, or is its usage mostly limited to a form of semi-public, anonymous diaries kept by a small, stable group of users venting frustration? Moreover, what are the common topics of these posts? Can they be further divided in larger categories of frustration (e.g. relating to parents-in-law, housework, finances, children, etc)? Finally, what can this, in a greater socio-cultural context, tell us about gender roles and marriage expectations in Japan?
Those are the kind of questions for which quantitative analysis of social media datasets might inductively help to lead the researcher to new theories, or instead strengthen one’s existing hypotheses. Having completed the previous tutorial and given a bit more work outlined below, this blog post introduces the reader to some very basic metrics and graphs that could already assist us in shedding some light on the above questions.
Preliminary analysis
Datasource
For the purpose of both this article and the project highlighted above, one specific hashtag tying into the discourse of marital stress on Twitter was taken as the target of our analysis: #husbandstress (dan’na sutoresu, #
The dataset was obtained using our historical search script with the lang='ja' option enabled (limiting tweets to the Japanese language) on the above hashtag; ran for the first time on 8 May, 2020 (right after an extended golden week), with subsequent runs on 15 May, 2020, 22 May, 2020 and 29 May, 2020 (with the since_id argument set to the ID of the last tweet in each preceding set). The first set includes 886 tweets and retweets from the period between Thu Apr 30 05:55:28 UTC and Fri May 08 14:25:30 UTC.2 The second set includes 1178 (re)tweets tweeted between Fri May 08 15:21:46 UTC and Fri May 15 01:04:47 UTC. The third set includes 857 (re)tweets between Fri May 22 15:34:06 UTC and Fri May 15 01:55:21 UTC. The fourth and final set includes 686 (re)tweets posted between Fri May 22 16:51:16 and Fri May 29 13:54:15 UTC.
Note It should again be noted that even in the case of a query that has relatively low usage, such as the one used here, the Twitter search API does not guarantee completeness and the results are thus indicators of trends among the engaging audience, rather than exhaustive resources. As stated on developer.twitter.com: “The Twitter Search API searches against a sampling of recent Tweets published in the past 7 days. […] the standard search API is focused on relevance and not completeness. This means that some Tweets and users may be missing from search results.”
Processing & Cleaning
In order to built a clean dataset in CSV format, used to produce a variety of graphs, this blog provides a slightly edited variant of the parsing script from the previous tutorial. Some of the significant changes to the previous script are as follows:
- An option to exclude retweets, or to include more meta-information when opting to keep them
- The addition of
user_mentioninformation (i.e. other Twitter accounts tagged with @) - An option to choose the CSV output filename
- An option to localize time to the suspected timezone
- An option to calculate the total amount of retweets in our dataset and save tweets predating our calculations that were nevertheless retweeted since
- An option to check for double entries
- Performance & scalability: able to handle millions of rows and files taking up several gigabytes of disk space.
Pre-processing
Our edited script (also available for download on GitHub) thus look as follows:
Python script
1 2 3 4 5 6 7 8 9 10 11 12 13 14 15 16 17 18 19 20 21 22 23 24 25 26 27 28 29 30 31 32 33 34 35 36 37 38 39 40 41 42 43 44 45 46 47 48 49 50 51 52 53 54 55 56 57 58 59 60 61 62 63 64 65 66 67 68 69 70 71 72 73 74 75 76 77 78 79 80 81 82 83 84 85 86 87 88 89 90 91 92 93 94 95 96 97 98 99 100 101 102 103 104 105 106 107 108 109 110 111 112 113 114 115 116 117 118 119 120 121 122 123 124 125 126 127 128 129 130 131 132 133 134 135 136 137 138 139 140 141 142 143 144 145 146 147 148 149 150 151 152 153 154 155 156 157 158 159 160 161 162 163 164 165 166 167 168 169 170 171 172 173 174 175 176 177 178 179 180 181 182 183 184 185 186 187 188 189 190 191 192 193 194 195 196 197 198 199 200 201 202 203 204 205 206 207 208 209 210 211 212 213 214 215 216 217 | |
Note
The script above requires three new external libraries that need to be imported in our script (see lines 6 - 8): Pytz (used for date manipulation), ijson (used for reading large JSON files in chunks) and Pandas (a very powerful data manipulation and analysis library). Before doing so, first install them with the command prompt using pip (pip install pytz, pip install ijson and pip install pandas).
Technical notes
Some technical notes about the above script:
- Twitter adheres to the Coordinated Universal Time (UTC) time standard for date & time information of objects such as tweets and user accounts. If we have strong reason to believe that the tweets in our dataset were tweeted within the same timezone, and if we intend to use that data for our work, we may localize the timezone of all tweets (and/or the Twitter accounts tweeting those) in our dataset (see lines 8, 15, 41, 53, 78 and 107-111). In regards to our current dataset, which is fairly limited in size, it is fair to assume that with the possibility of some negligible exceptions, the vast majority (if not all) of those tweets were created within the Japanese timezone.
Note
Taking into account any daylight saving time adjustments, Pytz uses the UTC offsets of the desired timezone for its localization. The time_zone information we’re passing to the above localize_utc_object function should adhere to the TZ database names of the desired country (e.g. Asia/Tokyo).
- By adjusting the
modeargument of theopenfunction toa(append), rather thanw(write, which would overwrite any existing files), our script can append the results from a second JSON dataset to an existing CSV file. Furthermore, to ensure that we append results to the same output file every time we want to update our dataset over time, the script now takes an argument to define the filename of the CSV file our results will be written to (see lines 17 and 90). - If we decide to include retweets in our set (useful for meta information on those who retweet content), we could calculate the amount of times tweets have been retweeted based on the amount of retweets of that tweet in our dataset. Using a temporary helper CSV file, the original CSV is then rewritten to include this information.3 Moreover, if our dataset contains retweets of original tweets that predate the earliest tweet data we possess, this script further generates a list of those original tweets (e.g. /metrics/#旦那ストレス_old_retweets.csv), including information such as tweet ID, text, hashtags, user name of the original tweeter, time of creation, amount of retweets and a direct URL to that tweet (see lines 16, 49-68, 101-102 and 150-199).
- When working with JSON data files compiled over a larger period of time, it is not unlikely duplications of tweets might have entered our dataset. In order to remove possible duplicate tweets, a helper function iterates through all rows of a CSV file, keeping track of the rows with a unique ID, and rewrites the output file based on those unique values (see lines 19, 96-97 and 115-148).4
- Both scripts on this page use the Pandas data manipulation library to read CSV files in chunks, which slightly impacts speed but drastically reduces memory consumption by iterating over an arbitrary amount of rows at a time (see lines 6, 89, 91, 159-160, 165-171 and 182-199).
The script above thus takes several new optional arguments when run in command line. In order, they are:
- The timezone to localize Tweets by (defaults to
'utc') - A boolean to decide whether or not to include retweets (defaults to
True) - The name of the output file (defaults to the name of the JSON file with ’_parsed’ attached to it)
- A boolean to decide whether or not to calculate retweets for unique tweets (defaults to
True) - A boolean to decide whether to check for doubles in CSV based on the tweet ID (defaults to
True)
Note
The command in our command prompt (after first navigating to the correct folder using the change directory command cd) will therefore resemble something akin to: python python_parse_tweet_ver2.py search_tweets_#旦那ストレス_20200515_030826 Asia/Tokyo True #旦那ストレス True True. That command runs the above python script (python_parse_tweet_ver2.py) on a raw JSON file search_tweets_#旦那ストレス_20200515_030826.json, localizes the Tweets to Japanese Standard Time (JST), includes retweets, outputs to a CSV file called #旦那ストレス.csv, calculates the amount of times tweets have been retweeted since they were tweeted, and finally, checks for any duplicates in the CSV file.
Metrics & Graphs
Calculating Metrics with Python
Based on our existing CSV we can now start calculating various metrics and produce graphs with our spreadsheet software of choice. As-is, there is plenty we could do already solely by importing the ‘master CSV’ file generated earlier and using pivot tables and graphs. This blog post, however, provides another script with a variety of helper methods to calculate and export some of the most prevalently used metrics in separate CSV files. This part will therefore, again, briefly elaborate on that python script, before proceeding to demonstrate the kind of visuals that can be extracted from the generated data and how it might fit into one’s research project. The script below thus contains four general helper functions:5
Note
Similar to before, the script below (available on GitHub) should be saved in the folder we have used thus far to store the rest of our script files in (e.g. ‘C:/python_examples‘ → ‘python_metrics.py’).
The next script take one argument: the name of the input CSV file generated with the script above. The commands used to execute our script could thus respectively look like: python python_metrics.py #旦那ストレス (output CSV files are stored in a new folder named after the input, e.g. ‘/metrics_#旦那ストレス/’).
- User data: generates a list of all unique users in our dataset, including 1) calculated fields such as the amount of tweets and retweets each user has contributed to our dataset or how many times their tweets were retweeted, and 2) general information such user name, description, account creation date, following/follower count and the total amount of tweets (taken at the time of the most recent contribution to our dataset).
- Hashtag frequency: generates a list of each unique hashtag, the amount of times it appeared in (re)tweets and the amount of (re)tweeters having used that hashtag.
- Date frequency: generates, for each day in our dataset, the amount of tweets, retweets, unique tweeters, retweeters and overlap between tweeters | retweeters in our dataset.
- Time frequency: generates the same as above, filtered by hour.
Essentially, this script iterates through each tweet in our input CSV file, storing the required information in python ‘dictionaries’. Upon finishing, it again iterates through each of those python dictionaries, writing the content to helper CSV files containing metrics for each of the four functions defined above.
1 2 3 4 5 6 7 8 9 10 11 12 13 14 15 16 17 18 19 20 21 22 23 24 25 26 27 28 29 30 31 32 33 34 35 36 37 38 39 40 41 42 43 44 45 46 47 48 49 50 51 52 53 54 55 56 57 58 59 60 61 62 63 64 65 66 67 68 69 70 71 72 73 74 75 76 77 78 79 80 81 82 83 84 85 86 87 88 89 90 91 92 93 94 95 96 97 98 99 100 101 102 103 104 105 106 107 108 109 110 111 112 113 114 115 116 117 118 119 120 121 122 123 124 125 126 127 128 129 130 131 132 133 134 135 136 137 138 139 140 141 142 143 144 145 146 147 148 149 150 151 152 153 154 155 156 157 158 159 160 161 162 163 164 165 166 167 168 169 170 171 172 173 174 175 176 177 178 179 180 181 182 183 184 185 186 187 188 189 190 191 192 193 194 195 196 197 198 199 200 201 | |
Spreadsheet Graphs
This section contains some graphs we might create upon importing the metric CSV files, generated with the script above, into a spreadsheet application.6
Note
The content of the Tweets and the description of the users remain as-is, including newlines, URLs, hashtags and emojis. Older versions of MS Excel, in particular, might have trouble correctly importing CSVs because of that. If using an older version of Excel is a must and importing the CSV results in faulty data, the best option would be to use OpenRefine to export the CSV as a valid Excel file (make sure that UTF-8 is selected for character encoding and that the radio button indicating columns are separated by commas is checked). Moreover, ensure that the Tweet ID columns are set to text rather than int64, in order to prevent Excel from cutting of digits in its conversion.
Date & time frequency
The time-series graphs below represent changes over time and were made after importing the date frequency and time frequency CSV files in Excel 2019. Both Figure 2 (a line chart measuring all occurrences over time) and figure 3 (a stacked area chart showcasing the total amount of tweets of a daily timespan split in original tweets and retweets) reveal a strong peak in retweets on the 13 th of May. This spike obscures the visual effectiveness of the rest our graphs. A solution is thus to split the count of Tweets and retweets over two different horizontal axes (figure 4), or use a 100% stacked bar graph to view the relation between the total tweets and retweets (figure 5).
Note
Data for the first and last day in our set (respectively 04/30/2020 and 05/29/2020) contains data only up to a certain point of that day and has thus been left out of the following graphs.
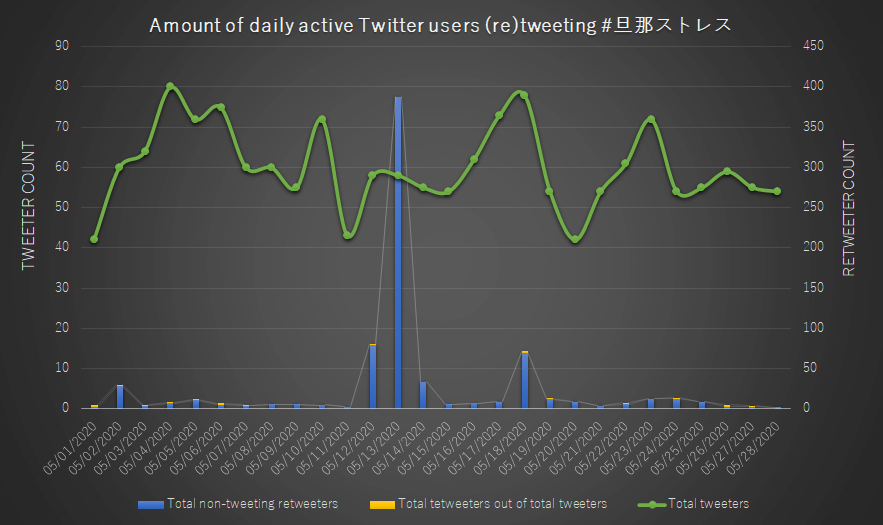 Figure 1: Amount of daily active Twitter users (re)tweeting #旦那ストレス
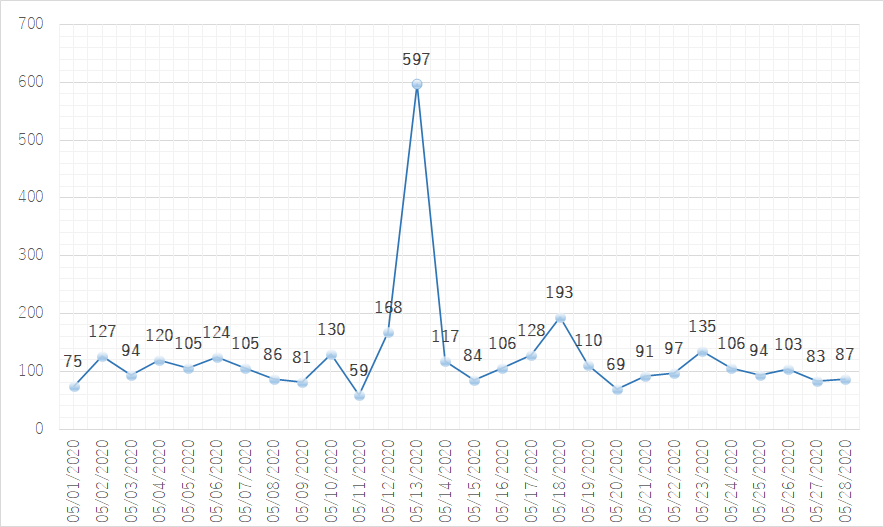 Figure 2: Total combined tweets containing #旦那ストレス
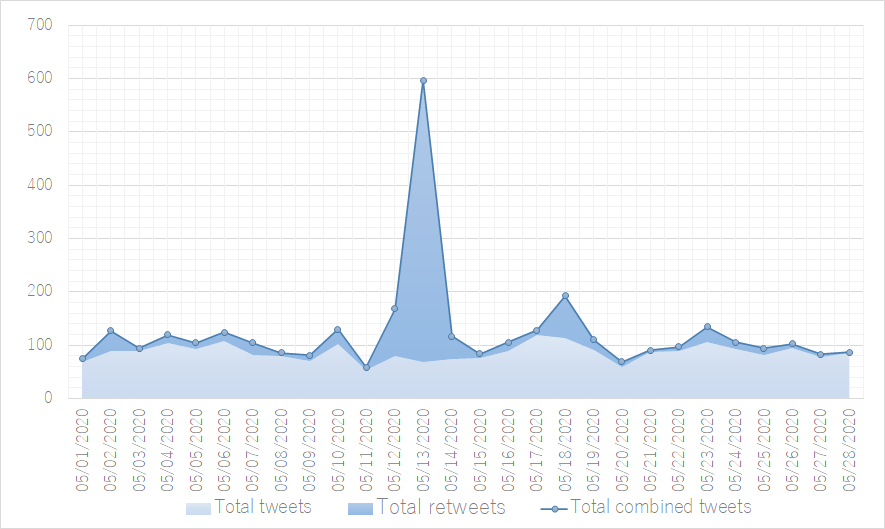 Figure 3: Total tweets & retweets Containing #旦那ストレス
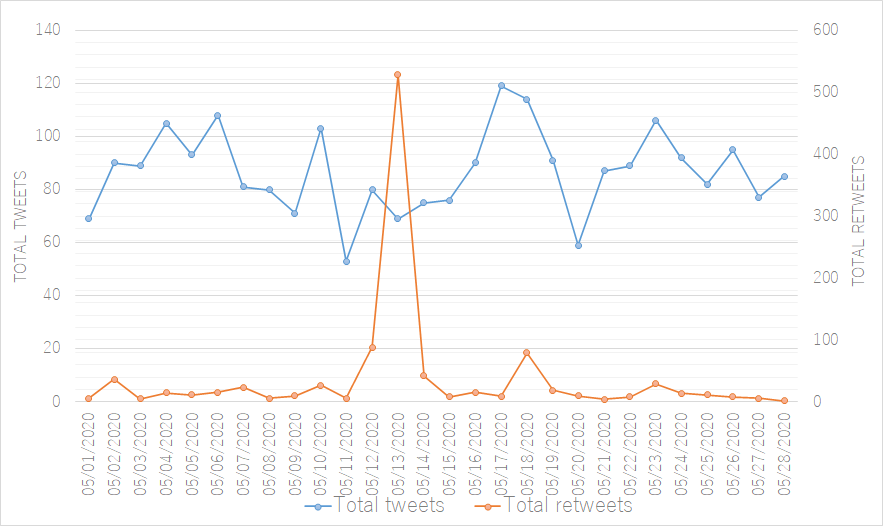 Figure 4: Total tweets & retweets Containing #旦那ストレス
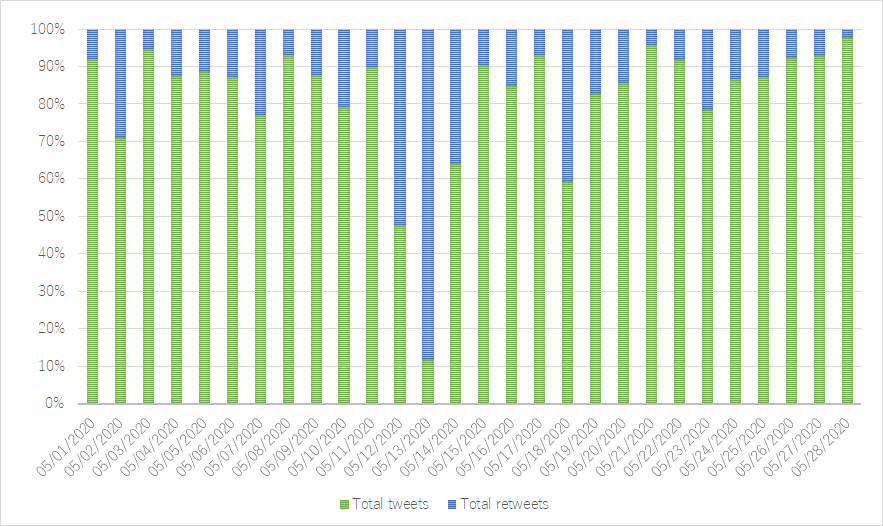 Figure 5: Tweet/retweet division of combined total containing #旦那ストレス per day
In regards to the question of a public sphere and interconnected discourse forming around this hashtag, we might be interested in knowing how many of those retweeters are actually actively writing similar Tweets themselves (and thus engaging with others connected by the hashtag) as well. In that case, we could use a mixed graph with stacked bars for visualizing retweeters in two groups (the right axis) and a line measure for the count original tweeters on the left (figure 1). One immediate takeaway is that only a very small number of retweeters have actually tweeted similar content themselves, suggesting that there might not be much engagement among active tweeters (and thus unlikely to develop into a public or community developed through this hashtag).7 From a glance it is furthermore clear that the amount of active tweeters practically doubled during the first couple of days of the extended holiday (golden week) in Japan, with gradual ups and down in activity since. The same goes for retweet activity, with a clear exception present around the period of May 13 (more on that below).
Using the spreadsheet table overview of our full CSV data as well as spreadsheet pivot functionality helps bring clarity to this trend deviation. The deviation concerns several tweets of one particularly active user with thousands of followers, but with a nevertheless low amount of posts actually being retweeted or replied to. Although the most prominent Tweet (which accuses the husband of intending to hoard the cash handouts each household member would receive in light of the Corona virus) was made prior to the first Tweet in our set, it didn’t get picked up on until late May 12 (with an increase in pace after being retweeted by a prominent Twitter influencer with over 80.000 followers). Subsequent retweets more or less lasted until the early night of May 14.
Moreover, the follower count of that Twitter user increased fifteen fold between the first and last raw JSON data files we obtained including that user’s Tweets. It should also be noted that although having frequently used both the husband stress and related hashtag #husbanddeathnote (dan’na desunōto, #
The renewed peak in (original) Tweets and (unique) tweeters shortly after the initial retweet peak of May 13 suggests a brief reinvigorating effect after a period of stagnation. Nevertheless, it is recommended to conduct a closer content analysis (using quantitative and qualitative methods) of the Tweet content to deduce whether those Tweets are indeed signaling an increase in users utilizing the medium to discuss dissatisfaction in regards to their spouses, or are instead meta-conversations on the existence of those hashtags (as is so often the case with viral hashtags).
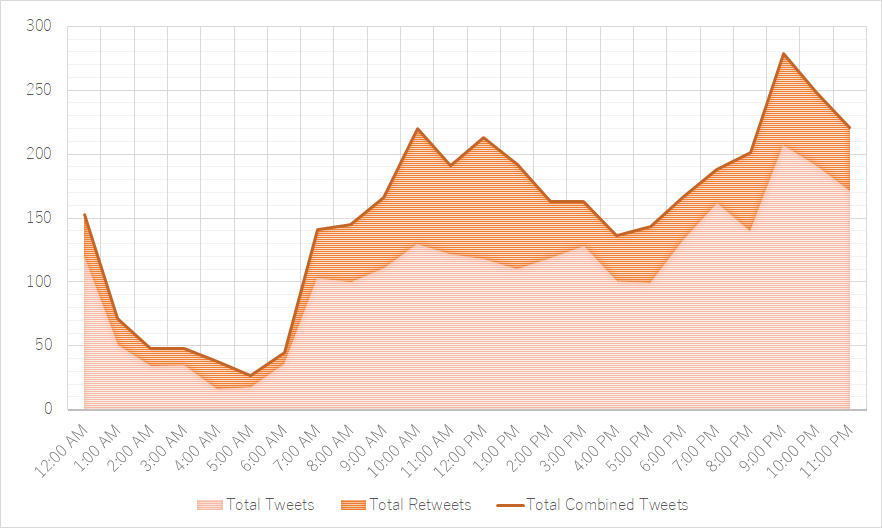 Figure 6: Total hourly (re)tweets containing #旦那ストレス
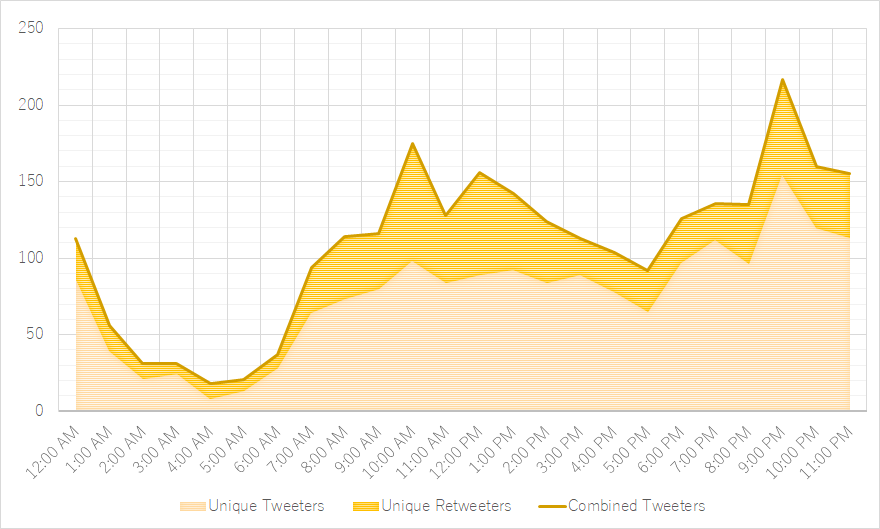 Figure 7: Total hourly (re)tweeters engaging with #旦那ストレス
Finally, while spreading the tweeting (figure 6) or tweeter (figure 7) rate on an hourly basis might have its benefits for specific use cases, it does not yield particularly surprising results when applied to our dataset. While it is not much of a stretch to assume that the vast majority of tweets in our dataset are posted by mothers8 with a particular rigid daily schedule, it is reasonable to believe that the peaks in activity in the late evening, as well as right before and after lunch are common among unrelated Twitter users as well.
Hashtag frequency
These next graphs are based on the top ten hashtags sorted by frequency of appearance (excluding, of course, the hashtag we have used as the query to collect our data). With the exception of figure 10 (which counts based on the total amount of unique Twitter users rather than total tweets) as demonstration of marginally different results, all are sorted by total combined (re)tweets. Figure 8 is an English translation of Figure 9, and Figure 11 juxtaposes the amount of tweeters and retweeters with the total amount of tweets and retweets per hashtag. It should be noted that these statistics are based on the individual occurrence of each hashtag and thus does not keep in mind the overlap of multiple such hashtags in one particular tweet (some tweets consisted of nothing more than several hashtags and an annexed image).
The majority of the hashtags are idle complaints targeting the spouse with various levels of playfulness. The highest ranking hashtag, #husbanddeathnote (dan’na desunōto, #
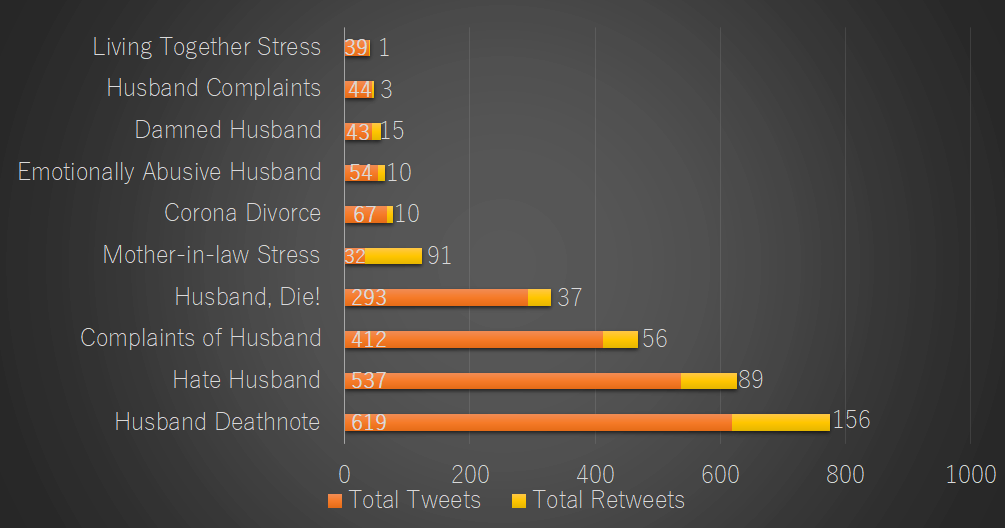 Figure 8: Top 10 used hashtags sorted by combined total (re)tweets containing #旦那ストレス (English translation)
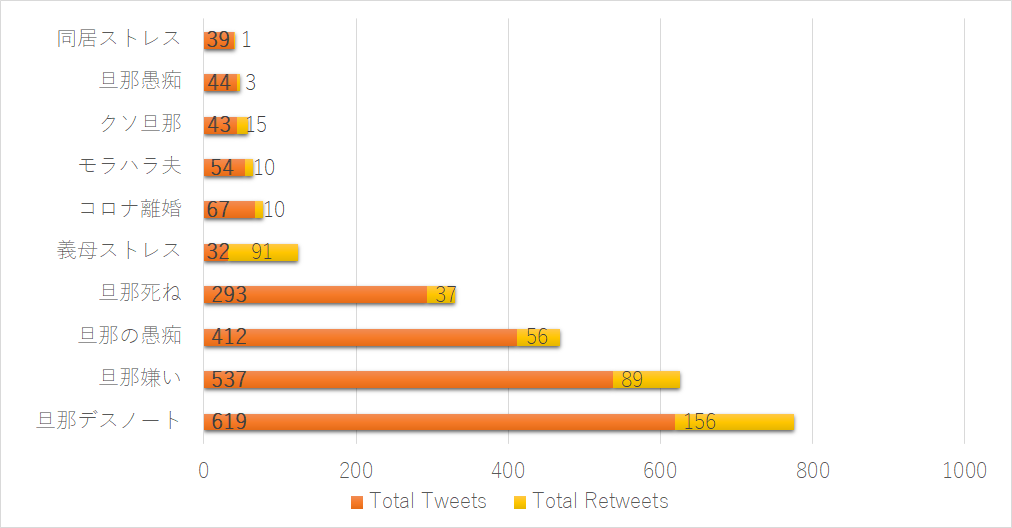 Figure 9: Top 10 used hashtags sorted by combined total (re)tweets containing #旦那ストレス
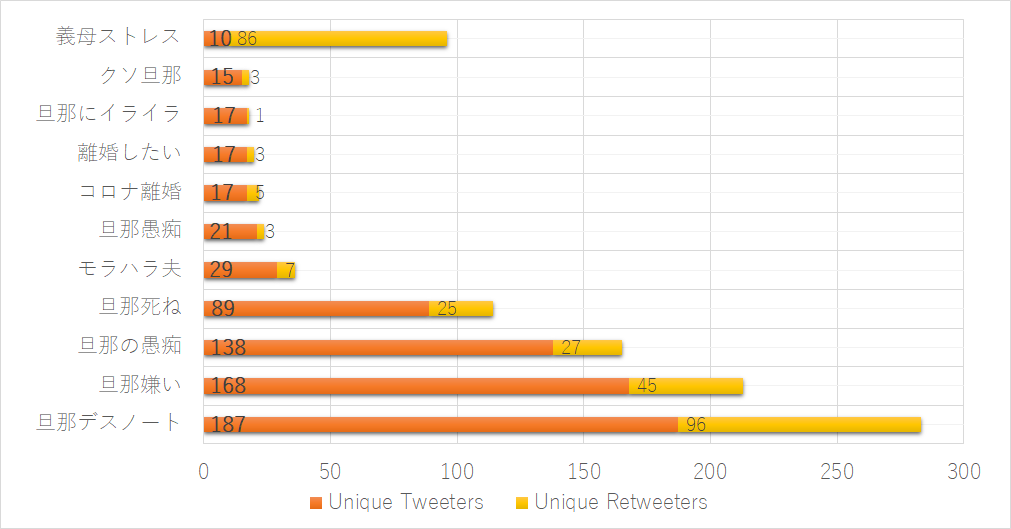 Figure 10: Top 10 used hashtags sorted by original tweets containing #旦那ストレス
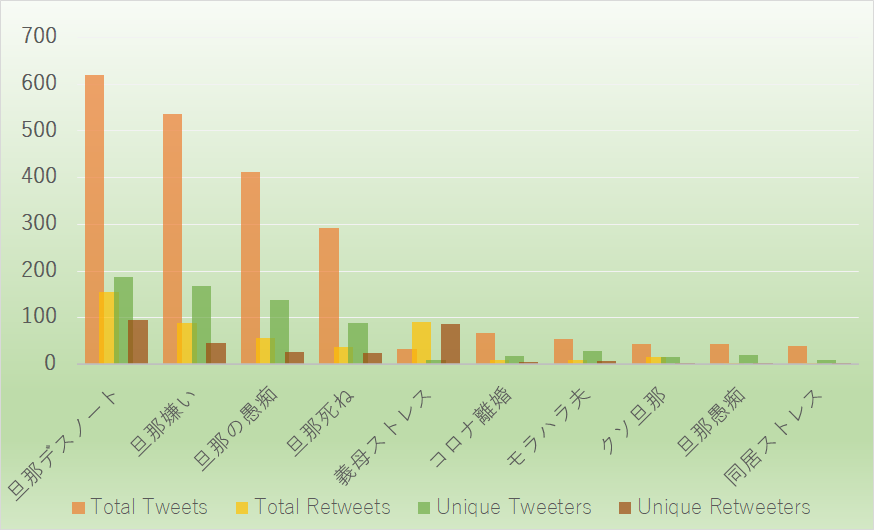 Figure 11: Top 10 used hashtags original tweets containing #旦那ストレス
Other noteworthy hashtags are “#coronadivorce” (Korona rikon, #コロナ
User Data
Based on the generated user data CSV, we might use pivot functionality to build graphs visualizing the relation between things such as date of user registration and tweets.
Figure 13, for example, visualizes users, with at least one actively tweeted message containing #
Based on those graphs, we can thus conclude that the majority of the Twitter users actively posting tweets containing this hashtag registered their account on Twitter extremely recently, most likely as a second, private account (often referred to as ura’aka, #
Taking a different angle to demonstrate the same thing, Figure 12 displays the amount of (re)tweets posted on a yearly basis both separate and as running total. Again, this graph suggest that there is not anything particularly outstanding concerning the registration date for users retweeting such content, while simultaneously showing that the most actively tweeting accounts have all been created very recently.
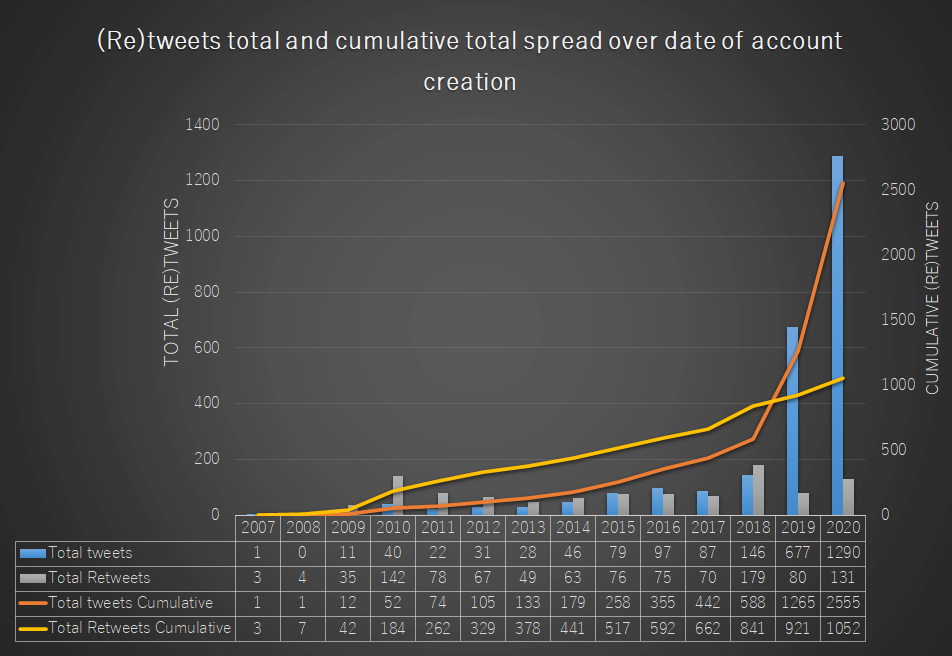 Figure 12: (Cumulative) totals of (re)tweets containing #旦那ストレス spread over date of account creation by year
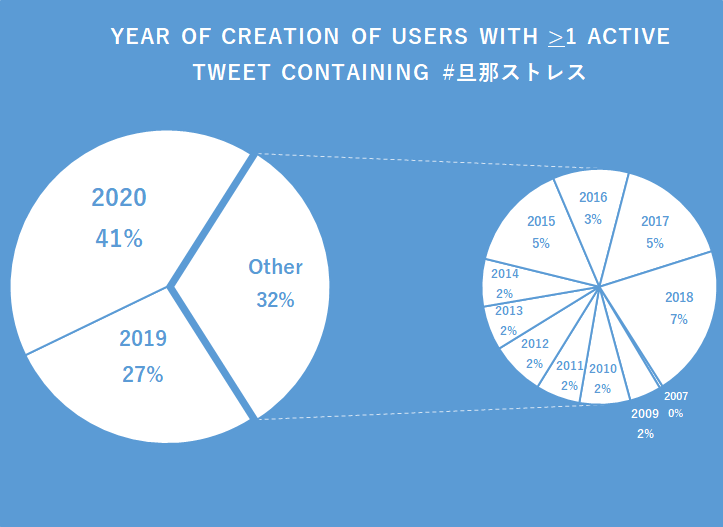 Figure 13: Year of creation of Twitter users in our dataset having posted more than one post containing #旦那ストレス
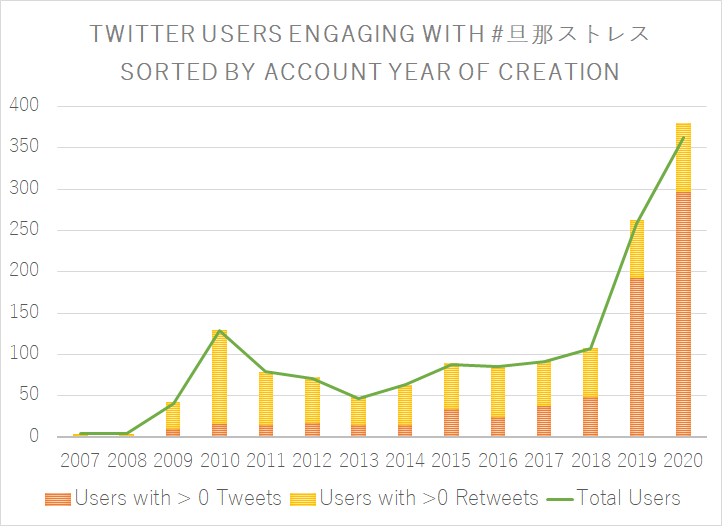 Figure 14: Twitter users engaging with #旦那ストレス, sorted by account year of creation
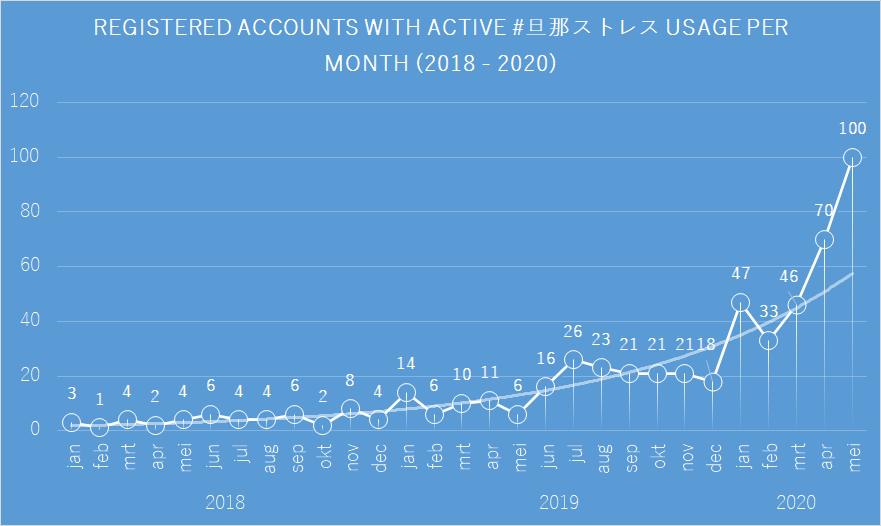 Figure 15: Registered accounts with active #旦那ストレス usage per month (2018 - 2020)
 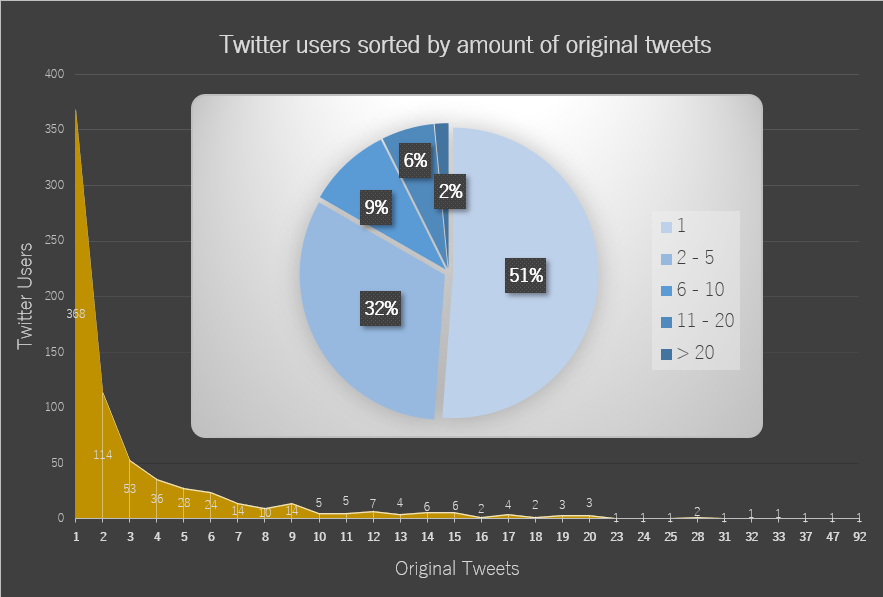 Figure 16: Twitter users sorted by amount of original tweets containing #旦那ストレス
 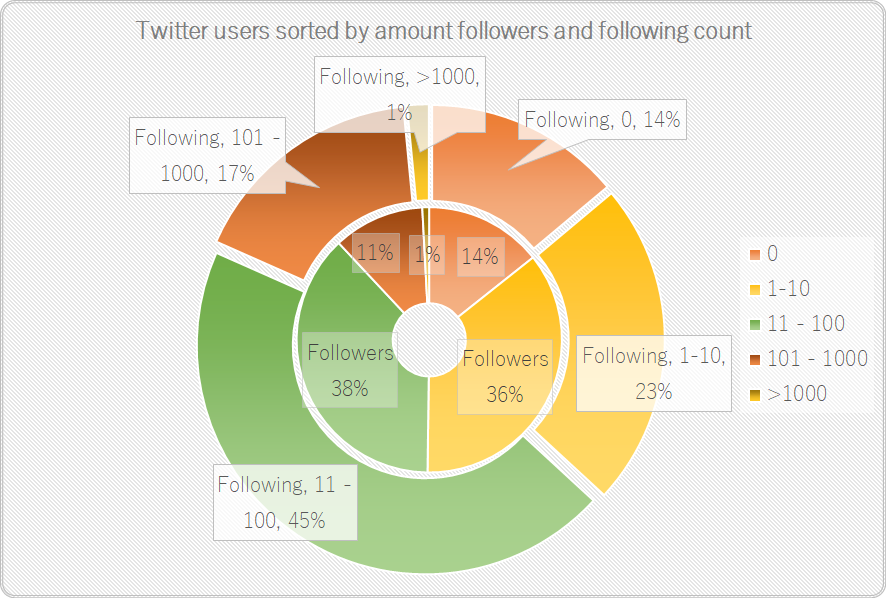 Figure 16: Twitter users posting original tweets containing #旦那ストレス, sorted by followers and following count
 Finally, the two ugliest graph on this blog (figure 16 and figure 17) reveal more about the level of engagement of Twitter users actively posting themselves, as well as the possible reach and/or attempts to interconnect with others based on the amount of followers and ‘friends’ (i.e. their following count). About half of those users have tweeted content with the #
One such Twitter account, for example, has over 300.000 followers. By sorting the users table by followers, this was revealed to be the public account of Shinya Arino, a famous Japanese comedian who might have possibly come into contact after a particular tweet mentioned earlier went relatively viral on the 13th of May. By cross-referencing our full CSV table with this name, the content and date of creation of Shinya’s tweet was easily revealed: 「このハッシュタグは #
Automation: Bringing Everything Together
In a research project that requires the collection of Twitter data over a long period of time, it is understandably a drag to manually update the preprocessed data (and its derisive metrics in CSV format) through various separate scripts run from the command line each time new data is to be collected. One method of simplifying those steps is to use a batch script12 that automatizes several or even all of the acts we have been doing manually. Upon saving and running the following script, for example, it will iterate through all the unprocessed JSON files with a filename matching the name of the batch file (e.g. #旦那ストレス.bat → all JSON files containing #旦那ストレス) and run them through python_parse_tweet_ver2.py with predefined options such as setting the timezone to “Asia/Tokyo” (keeping the total calculation and check for doubles until the final JSON has been processed). Finally, this batch script will run the preprocessed CSV file through the parsing metric script we have outlined in this article.
1 2 3 4 5 6 7 8 9 10 11 12 13 14 15 16 17 18 19 20 21 22 23 24 25 26 27 28 29 30 31 32 33 34 35 36 37 38 39 | |
This script could be further edited to begin by first datamining new JSON data with any of the API scripts provided earlier, potentially using the Windows Registry to keep track op the since_id variable. If desired, we might also schedule this script to run periodically using the Windows schedule manager (e.g. to run the Search API script and its preprocessing and parsing scripts on a weekly basis, or even on a daily basis if daily updated statistics on account information, such as follower and following count, is preferred).
If we are using spreadsheet software that maintains a connection with the CSV data sources for its tables and graphs, updating our graphs to reflect those changes is a matter of pressing a single update button (such as the Data → Refresh All button in MS Excel 2019).
Legal and Ethical Caveats
Having glanced over both the above tutorial and the provided graphs or data, the reader might have (with one exception) noticed a lack of direct references to concrete Tweets or users. Japanese Tweet content has either been translated to English without supplying any identification, or visualized through calculated metrics. Moreover, this series does not provide access to the original JSON files or to the preprocessed CSV files. This is done deliberately both according to Twitter API’s terms of service (which prohibits sharing raw, unprocessed Tweet data) and, from an ethical standpoint, to protect the identity of its users (regardless of the public accessibility of those users’ Tweets and the levels of anonymity their accounts provide). One jarring exception this article made is the explicit reference to Shinya Arino, a public figure who is using Twitter with the explicit purpose of reaching a large public. Verbatim quoting his tweet, then, was done purposefully to illustrate the ethical line one must thread when revealing personal information of social media users.
Traditionally, informed consent, anonymity and confidentiality are crucial elements of research involving public opinion of private individuals. For over a decade, social media platforms has been providing (budding) researchers the opportunity to engage with an unprecedented amount of data representing public opinion, creating somewhat of a gray zone within academic research concerning the above elements. From a legal perspective, Twitter’s Privacy Policy does indeed inform its users that all public data could be used for the purpose of academic research. Yet, as Fiesler and Proferes (2018)13 rightly point out, social media users are often not aware of the extent their content on those platforms can be used. Instead, Fiesler and Proferes highlight several prominent examples of scandals or public outrage in regards to publications that have used such data, even if they did not break any legal boundaries.
One could argue that this ethical boundary is highly individual. Data on platforms such as Twitter is explicitly open, more so when containing hashtags whose prime function is to reach a wider audience.14 Moreover, websites such as Buzzfeed have financially thrived on using tweets from private individuals for comical effect. In an era of meme-dominated pop culture, it is furthermore extremely common to find memefied tweets spreading across other media platforms.
Especially in light of the recent Cambridge Analytica scandal, however, utter care must be taken that no risks befalls any individual whose social media content is part of one’s research data; especially when dealing with sensitive topics such as the one highlighted in this article. Generating quantitative data that does not pinpoint individual content (such as the statistics provided in this article, and text analytics such as frequency tables, sentiment analysis, etc) is but one specific part of social media-based research, and often goes hand in hand with qualitative readings of certain content. What if I published a paper on this topic that would later be cited by a major Japanese news outlet? If I had referenced a particular tweet by a user who had afterwards revealed personal information, could it not potentially endanger that Twitter user? This is of course highly unlikely, but nevertheless not impossible and something that should be kept in mind when taking a research angle dealing with such data.
Although Woodfield (2017, ch.4)15 refers to a research project that took a similar stance as I did concerning the masking of individual user names and paraphrasing rather than quoting tweet content, Woodfield has also referred to another research project in which researchers retrospectively searched informed content of each Twitter account whose tweet content they would individually use in their publications. This might seem excessive, and on a purely legal basis not even required, but even in the case of a graduate thesis rather than a PhD thesis or academic publication, it is at the very least not unwise to contact the board of ethics of one’s university for clarity on how to best deal with data obtained from social media from an ethical point of view.
Wait! There is more!
Some of the graph examples and analyses in this article might appear overly excessive, especially when keeping in mind the limited scope of the highly specific hashtag analyzed.16 Nevertheless, it is my hope that those graphs served some purpose in illustrating how social network analysis and the methods outlined in this article might fit in research topics covering contemporary issues and public opinion expressed online.
Throughout the next entries in our blog series, we will dive further into actual textual analysis of Japanese corpora. In the third blog, we will look into the Japanese computational linguistics tool KH Coder, the morphological parser MeCab and its extensions, as well as the various options they offer us in our quantitative text analysis. The fourth blog will expand on the script provided in this article, including options for animating changes over an arbitrary timespan.
- A
QuickGuide to Data-mining & (Textual) Analysis of (Japanese) Twitter Part 1: Twitter Data Collection - A
QuickGuide to Data-mining & (Textual) Analysis of (Japanese) Twitter Part 3: Natural Language Processing With MeCab, Neologd and KH Coder - A
QuickGuide to Data-mining & (Textual) Analysis of (Japanese) Twitter Part 4: Natural Language Processing With MeCab, Neologd and NLTK - A
QuickGuide to Data-mining & (Textual) Analysis of (Japanese) Twitter Part 5: Advanced Metrics & Graphs
On a final note, it is my aim to write tutorials like these in such a way that they provide enough detail and (technical) information on the applied methodology to be useful in extended contexts, while still being accessible to less IT-savvy students. If anything is unclear, however, please do not hesitate to leave questions in the comment section below.
-
Still image from the 2012 Japanese animated film Wolf Children by Mamoru Hosoda, used under a Fair Use doctrine. ↩
-
The Coordinated Universal Time (UTC) time standard; a universal standard similar to the Greenwich Mean Time (GMT) timezone. ↩
-
Although the original JSON tweet objects contain a
retweet_countvariable, this contains all the retweets of that post from its conception up to the point we first acquired it in our dataset. This is not sufficient for long term data mining projects. Unfortunately it’s quite taxing to calculate replies the same way, and the Twitterreply_countvariable is only available to Premium and Enterprise Twitter API services. ↩ -
It’s important to check on tweet ID doubles rather than on unique rows because secondary data such as follower and following count of the user might have changed by the time we have obtained new data with some duplications. In other words, even if the Tweet itself is a duplication, the row in our CSV file wouldn’t be counted as such. ↩
-
While functional and rigidly tested through various use-cases, this script is far from optimized and not very pythonic. I will rewrite this in due time, using in particular the python package pandas. ↩
-
It should be noted that some of the data we calculate by means of python could fairly easily have been derived from the base, preprocessed CSV file using pivot tables. About half of the data couldn’t, however, and centralizing everything in one script was a deliberate choice. ↩
-
Another option to gouge this is by viewing overlap of followers and followings of the most active users (network analysis) over a certain timespan, which is what we will be doing in a next blog entry. ↩
-
A glance over the description of all tweeters seems to suggest so (with language and emojis indicating one’s social identity as a mother or raising children), and could be further confirmed by textual analysis. ↩
-
Or to be exact, death wishes. 💀 The slogan furthermore refers to the corona virus, demanding the spouse to get infected as fast as possible. ↩
-
Indicating the limited nature of analyzing only one particular social media platform, since various platforms might perform together to form unique eco-systems on which discourse can thrive. ↩
-
The social problem of toxic relations with parents-in-law was furthermore the topic of the bestseller 2016 novel The House on the Slope (Saka no Tochū no Ie, 『坂の途中の家』) by Mitsuyo Kakuta, and its 2019 live action adaption. Both reinvigorated public interest in contemporary marital issues in Japan and concluded with the possible importance of social media towards empowering women stuck in toxic marriages. ↩
-
Short for computerized batch processing. ↩
-
Fiesler, Casey, and Nicholas Proferes. 2018. ‘“Participant” Perceptions of Twitter Research Ethics’. Social Media + Society 4 (1): 2056305118763366. https://doi.org/10.1177/2056305118763366. ↩
-
Even though its usage might often be for aesthetic or comic purposes. ↩
-
Woodfield, Kandy. 2017. The Ethics of Online Research. Emerald Group Publishing. ↩
-
Not withstanding the greater social relevance of the topic that encompasses this hashtag, either. ↩